|
Article Information
|
Authors:
Iqbal Rashid1
Langalibalele H. Mabuza1
Indiran Govender1
Deidre Pretorius1
Affiliations:
1Department of Family Medicine and Primary Health Care, University of Limpopo (Medunsa Campus),
South Africa
Correspondence to:
Iqbal Rashid
Email:
dr_riqbal@yahoo.com
Postal address:
PO Box 222, Medunsa, 0204, South Africa
Dates:
Received: 22 Oct. 2010
Accepted: 23 Apr. 2011
Published: 14 Oct. 2011
How to cite this article:
Rashid I, Mabuza LH, Govender I, Pretorius D. Volume of sputum to detect acid-fast bacilli as a measure of quality for the diagnosis of pulmonary
tuberculosis at the Dr George Mukhari Hospital, South Africa. Afr J Prm Health Care Fam Med. 2011;3(1), Art. #240, 6 pages.
doi:10.4102/phcfm.v3i1.240
Copyright Notice:
© 2011. The Authors. Licensee: AOSIS OpenJournals. This work is licensed under the Creative Commons Attribution License.
ISSN: 2071-2928 (print)
ISSN: 2071-2930 (online)
|
|
|
|
Volume of sputum to detect acid-fast bacilli as a measure of quality for the diagnosis of pulmonary tuberculosis at the Dr George Mukhari Hospital, South Africa
|
|
In This Original Research...
|
Open Access
|
• Abstract
• Introduction
• Setting
• Contribution to the field
• Ethical considerations
• Method
• Design
• Materials
• Patients
• Specimen collection and laboratory methods
• Analysing
• Results
• Discussion
• Conclusion
• Acknowledgements
• Competing interests
• Authors’ contribution
• References
|
|
Background: Optimum sputum results for acid-fast bacilli (AFB) microscopy are linked to a sputum quantity of at least 5.0 mL. This study was aimed
at establishing the effect of sputum quantity in the pick-up rate of AFB microscopy by comparing sputum samples of 5.0 mL and 2.0 mL.
Methods: An analytical cross-sectional study was carried out at the Dr George Mukhari Hospital (DGMH) in Pretoria, South Africa, from 05 January 2007 to 04
January 2008. Two sputum samples, 5.0 mL and 2.0 mL, were collected from each of the 330 adult PTB (pulmonary tuberculosis) suspects. Fluorescence
microscopy was used in the sputum analysis. The yield through microscopy of the 2.0 mL specimen versus the 5.0 mL specimen was compared and analysed,
using culture results as the gold standard.
Results: From a sample of 330 specimens, 77 tested AFB positive on microscopy. In the 5.0 mL samples, the sensitivity was 76.6% (95% CI, 66.0% –
84.7%), specificity 99.6% (95% CI 97.8% – 99.9%), positive predictive value (PV+) 98.3% (95% CI 91.1% – 99.7%), negative predictive value
(PV-) 93.3% (95% CI 89.7% – 95.7%), the likelihood ratio (LR) for a positive microscopy 192 and the LR for a negative test was 0.23. In the
2.0 mL specimens, the sensitivity was 75.3% (95% CI 64.6% – 83.6%), specificity 99.2% (95% CI 97.1% – 99.8%), positive predictive value
(PV+) 96.7% (95% CI 88.6% – 99.1%), negative predictive value (PV-) 93.0% (95% CI 89.3% – 95.4%), the LR for a positive
microscopy was 94 and 0.25 for a negative microscopy. There was a statistically significant association (p-value < 0.001) between the microscopy
and culture tests in both the 5.0 mL and the 2.0 mL specimen categories. The strength of association between the microscopy and culture, as indicated by
the kappa test was 0.83 and 0.81 in the 5.0 mL and 2.0 mL categories, respectively.
Conclusion: Compared to the 2.0 mL specimen category, the yield for AFB microscopy in the 5.0 mL specimen category was consistently superior, as
indicated by the higher sensitivity, specificity, predictive values and the likelihood ratios in the 5.0 mL specimen category. It is recommended that sputum
specimen collection for AFB microscopy should aim for a minimum volume of 5.0 mL.
Setting
Globally, an estimated 8 million new cases of tuberculosis occur annually, mostly in developing countries.1,2 According to the World Health
Organisation (WHO) 2010-report, the estimates of the global burden of disease caused by TB (tuberculosis) in 2009 were 9.4 million incident cases and 14
million prevalent cases.3 In South Africa the control of TB continues to be a major concern.4
The Ziehl Nielsen (ZN) staining procedure is the cornerstone of demonstrating the acid-fastness of the bacteria. Prompt diagnosis of TB plays a pivotal role in
therapy outcome. However, some cases suspected of pulmonary tuberculosis on clinical grounds, are not confirmed bacteriologically because of a patient having a dry
cough or inadequate sputum (< 2.0 mL). This results in false negative sputa in about 25% – 50% of cases of pulmonary tuberculosis.5
Contribution to the field
Adequate sputum is required for a diagnostic yield in AFB detection. Researchers have suggested the use of 5.0 mL as adequate sputum for AFB detection
in the diagnosis of PTB (Pulmonary tuberculosis).6,7,8 In this regard, the study became necessary because, at the time of the study, the Level One
wards at the hospital did not have a policy relating to a recommended sputum quantity. We conducted this study to compare the yield of a 5.0 mL versus a
2.0 mL specimen.
Ethical clearance to conduct the study was obtained from the Medunsa Research Ethics Committee (MREC) of the University of Limpopo (Clearance Certificate Number:
MREC/M/50/2009).
Design
From 05 January 2007 to 04 January 2008, a cross-sectional descriptive study was conducted at the Dr George Mukhari Hospital, Pretoria, to determine if the
volume of sputum affects AFB microscopy yield. Each patient was requested to cough up two sputum samples at least 2 hours apart in the early morning.
There is no consensus or evidence on the acceptable time lag (e.g. 2 hours versus 24 hours apart) between sputum sample collections for a better
yield in sputum smear microscopy. The research assistant (a nurse) supervised the sputum collection. Each patient was requested to cough up sputum into the
specimen bottle until the sputum quantity reached the labelled mark on the bottle, 2.0 mL or 5.0 mL. When necessary, a patient was requested to cough
up additional sputum to fill up the specimen bottle to the required mark. On an alternating basis, one patient was requested to start filling up the 5.0 mL
green-labelled specimen bottle, followed by the 2.0 mL red-labelled specimen bottle at least 2 hours apart. The next patient was requested to reverse
the order, starting with the 2.0 mL, then the 5.0 mL specimen bottle. This was done to ensure an even distribution in the order of sputum quantity
collection to minimise a sputum collection bias.
Materials
The number of PTB suspects per annum seen at DGMH (primary health care) in 2007 was 2348.9 During the period of data collection, sputum samples
were collected randomly from TB suspects willing to participate in the study. Clinical suspicion of TB in patients was based on at least three of the following
criteria:
• a persistent cough for a period longer than 2 weeks
• night sweats
• fever
• loss of appetite
• weight-loss
• malaise
• chest pain
• shortness of breath
• a positive history of contact with an infectious TB patient.
Consenting patients provided sputa in sterile containers at room temperature.
Patients
Only patients above the age of 18 who consented to participate were included in the study. Using the SPSS 17.0 for Windows computer software, the representative
sample size computed at 95% confidence level and 5% confidence interval (CI), was 330 patients. Randomisation was achieved by selecting every seventh PTB suspect
admitted to Level One wards for inclusion in the study. If a particular patient declined participation, the next consenting patient was included, to be followed by
another seventh patient. Patients too ill to participate were excluded from the study.
Two sputum samples, one of 5.0 mL and the other of 2.0 mL, were collected from each adult PTB suspect. Patients were advised on how to enhance sputum
expectoration. Sputum samples were then taken to the laboratory within 2 hours of collection. The sputum was analysed with the aid of auramine staining
and fluorescence microscopy as previously described.10
Recruited patients were educated on the importance of producing a good sputum sample (not saliva or nasal discharge) and it was explained to them that two specimens
with different quantities were required. The patient was then shown and instructed on how to enhance sputum expectoration. Sputum collection took place in an open
area under direct supervision of one of the researchers to prevent infection of the researchers and other patients.
This following section does not describe data collection but specimen collection and laboratory methods.
Specimen collection and laboratory methods
The patient was given two sterile sputum containers, one labelled with a green marker and the other labelled with a red marker. The green-labelled container
was for the collection of 5.0 mL sputum whilst the red-labelled container was for 2.0 mL sputum. The level of the volume required was clearly marked
on each specimen container to guide patients as to the sputum quantity required. Both the 2.0 mL and the 5.0 mL sputum containers were subsequently
sent for microscopy and culture. Each specimen was given a different laboratory number and all specimens were thus treated separately as though they were from
different patients. Consequently, two laboratory analysis requisition forms were completed for each patient. Each specimen and attached requisition form were put
into specimen plastics, sealed and immediately taken to the laboratory. If there was an anticipated delay of more than 2 hours in transporting the specimen
to the laboratory, the specimen was stored in a refrigerator at 4 ºC.
Only sputum samples collected on the first morning were used in the study. Sputum samples collected on subsequent mornings or days, as required by the national
tuberculosis programme for diagnosis, were not included in the study. The culture was grown according to standard procedures by the National Health Laboratory
Services (NHLS) of South Africa, using the Mycobacteria Growth Indicator Tube 7 mL (MGIT) method. Culture tubes were entered into the BACTEC MGIT instrument
and continuously incubated at 37 ºC and monitored every 60 minutes for increasing fluorescence. Analysis of the fluorescence was used to determine
if the tube was instrument-positive, that is, if the test sample contained viable organisms. Culture tubes which remained negative for a minimum of 42 days
were regarded as negative.
Analysing
The statistical software mentioned above was used for data entry and analysis. Descriptive statistics, frequencies and percentages were calculated. Two-by-two tables
were drawn to determine the relationship between the 5.0 mL and 2.0 mL specimens as compared to the culture which was the gold standard test. For
statistical significance, the p-value was determined whilst kappa was used to measure the strength of agreement. The sensitivity, specificity, positive
and negative predictive values, and likelihood ratios for a positive and negative microscopy results of sputum samples were calculated to determine the relationship
between AFB microscopy and culture tests.
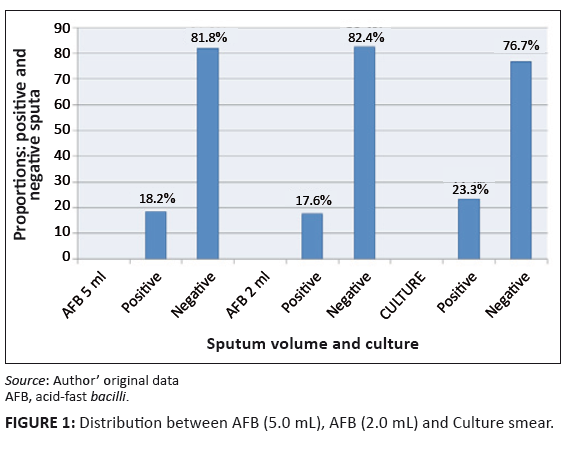 |
FIGURE 1: Distribution between AFB (5.0 mL), AFB (2.0 mL) and Culture smear.
|
|
|
TABLE 1: Relationship between acid-fast bacilli (5.0 mL) and culture for diagnosis
of pulmonary tuberculosis (N = 330).
|
|
TABLE 2: Relationship between acid-fast bacilli (2.0 mL) and culture for diagnosis
of pulmonary tuberculosis (N = 330).
|
The majority of the patients, 110 (32.1%), were aged 18–29, 95 (28.8%) were aged 30–40, 68 (20.6%) were 41–51 years old, 38 (11.5%) were
aged 52–62, 21 (6.4%) were 63–73 years old and 2 (0.6%) were aged 74–94.
Of the 330 patients, 146 (44.2%) were male and 184 (55.8%) were female. The prevalence of AFB positive sputum results in the 2.0 mL samples was 17.6% (58/330)
and 17.9% (59/330) in the 5.0 mL samples.
Sixty patients (18.2%) were positive and 270 (81.8%) were negative for the AFB test in the 5.0 mL category, whilst 58 (17.6%) were positive and 272 (82.4%)
were negative for the AFB test in the 2.0 mL category. The gold standard AFB culture results revealed 77 (23.3%) as positive and 53 (76.7%) as negative sputa.
In the 5.0 mL sputum samples, out of the total of 77 specimens that were positive according to the gold standard culture test, 59 tested positive on AFB
microscopy, resulting in a sensitivity of 76.6% (59/77), (95% CI 66.0% – 84.7%), (Table 1). Meanwhile, according to the culture test, 253 specimens tested
negative whilst 252 tested negative by microscopy, missing one specimen (false negative), resulting in a specificity of 99.6% (252/253), (95% CI 97.8% –
99.9%). The positive predictive value (PV+) was 98.3% (59/60), (95% CI 91.1% – 99.7%) whilst the negative predictive value (PV-)
was 93.3% (252/270), (95% CI 89.7% – 95.7%). The likelihood ratio (LR) for a positive microscopy in the 5.0 mL volume sputa was 192
[76.6 ÷ (100 - 99.6)], whilst the LR for a negative test was 0.23 [(100 - 76.6) ÷ 99.6].
Table 2 demonstrates that out of the 77 sputum smears (from the 2.0 mL specimens) which tested positive by culture, 58 were picked up by microscopy,
resulting in a sensitivity of 75.3% (58/77), (95% CI 64.6% – 83.6%). Meanwhile, out of the total of 253 specimens that were negative according to the
culture test, 251 tested negative by microscopy and two were missed (false positives), resulting in a specificity of 99.2% (251 253), (95% CI 97.1% –
99.8%). The positive predictive value (PV+) was 96.7% (58/60), (95% CI 88.6% – 99.1%) whilst the negative predictive value (PV-)
was 93.0% (251/270), (95% CI 89.3% – 95.4%). The likelihood ration (LR) for a positive microscopy in the 2.0 mL specimens was 94
[75.3 ÷ (100 - 99.2)], whilst the LR for a negative microscopy was 0.25 [(100 - 75.3) ÷ 99.2].
The 5.0 mL sputum smear test gave false negative results in 23.4% (18/77), (95% CI 15.3% – 34.0%) patients whilst the 2.0 mL sputum
smear test gave a false negative value of 24.7% (19/77), (95% CI 16.4% – 35.4%). There were 0.4% (1/253), (95% CI 0.07% – 2.2%) false positive results
encountered for 5.0 mL and 0.8% (2/253), (95% CI 0.2% – 2.8%) for the 2.0 mL sample.
The majority of the patients (60.9%) were between the ages of 18 and 40 years, of whom 53.7% were 18–29 years old. The incidence in the
18–40 age group in this study was slightly higher than a similar study conducted in Mexico (52%).11 We were focussing on PTB suspects on
clinical grounds, hence a wider scope, whereas their focus was mainly on radiological changes. The fact that TB suspects are in the young adulthood age-group
(hence breadwinners), has economic implications for the society. This places the onus on the clinician to properly diagnose each TB suspect by using the sputum
quantity with a better yield, to enable early therapeutic intervention.
The prevalence rate of the AFB positive sputa by microscopy was virtually similar in the 5.0 mL versus the 2.0 mL sputum specimens (17.9% versus
17.6%, respectively). The smear sensitivity rate of 76.6% obtained using the 5.0 mL sputum specimen, and 75.3% obtained using the 2.0 mL specimen,
from patients suspected of having TB in this study, was in keeping with the upper limit of the range of sensitivity for smear microscopy reported by Foulds and
O’Brien to vary from 30% to more than 70%.12 Matee et al., in a study conducted in the Muhimbili University in Dar es Salaam, Tanzania,
sought to determine the diagnostic accuracy of sputum microscopy for active case findings of HIV-associated PTB using TB culture as the reference standard.
No mention is made of the quantity of sputum used. However, their overall sensitivity and specificity of sputum microscopy was 61.8% and 99.7%,
respectively,13 which were lower than found in this study. This could be ascribable to the relatively smaller sample of culture positive sputum
results in this study compared to their sample (77 versus 212).
In a study conducted by Warren et al. over two periods, 1992–1993 and 1996–1999, the yield using a minimum of 5.0 mL sputum specimen for AFB
diagnosis was found to increase sensitivity for Mycobacterium tuberculosis (MTB), thus accelerating treatment of TB. In the first period, the
acid-fast staining was carried out using sputum specimens regardless of volume. In that way, a sensitivity of 72.5% was obtained, compared to 92.0% for sputum
specimens of volumes ≥ 5.0 mL during the second period.14 The better yield of the sputum specimens with the minimum of 5.0 mL tallied
with our study even though the methodologies used in the two studies differed. The relatively low sensitivity in our study could be attributable to
the comparatively smaller sample size and the high prevalence of HIV seropositive patients (65.2%) in our Level One wards, because there is an association between
decreased host immunity and reduced sputum smear positivity leading to an increase in false negative smears.15
In contrast with the likelihood ratio for a negative microscopy test that was almost similar in both the 5.0 mL and 2.0 mL sputum samples, the
likelihood ratio for a positive microscopy in the 5.0 mL sample was almost double that in the 2.0 mL samples (192 versus 94, respectively), clearly
in favour of the 5.0 mL sputum sample for AFB microscopy. Clinically, this finding indicates that by using a 5.0 mL specimen, the probability of
finding a false positive in a truly negative result is almost 50% lower than by using the 2.0 mL specimen. This finding was corroborated by the relatively
higher positive and negative predictive values in the 5.0 mL specimen category, compared to the 2.0 mL category. The difference is of clinical
importance because the diagnostic value of a test depends on its positive and negative predictive values, which vary with the prevalence of the disease in a given
community.16
As mentioned above, the smear microscopy used in this study was based on fluorescence microscopy of concentrated sputum sediments following centrifugation and is
commonly considered to have superior sensitivity compared with conventional light microscopy.17 The false negative results were slightly lower in the
5.0 mL specimens compared to the 2.0 mL specimens (23.4% versus 24.7%, respectively). Furthermore, the false positive results in the 5.0 mL
specimens were 50% lower than those in the 2.0 mL samples (0.4% versus 0.8%, respectively). An increase in false positive results reduces the specificity of
a test by increasing the denominator of specificity.18 The clinical implication of an increase in false positives is the over-diagnosis of a condition
with unnecessary commitment of resources on subjects who do not need the resources.
Supervised sputum collection by a health care professional during sputum collection is an important factor in obtaining quality sputum samples. Improving sputum
quality has been shown to improve the yield of sputum microscopy.14 Therefore, the best use of limited resources for the detection of smear-positive PTB
cases would be to improve the quality of self-expectorated sputum collection and microscopy. Only supervised sputum collection was used in our study, we did not use
augmented and invasive sputum collection techniques as recommended in other studies.19,20 However, PTB suspects who are unable to produce sputum, should be
followed-up regularly or even admitted to a health-care facility if possible. The inability to produce sputum is common in immunocompromised patients.21
There was a high prevalence of sero-positive patients in our Level One wards which led the researchers to the conclusion that every effort should be attempted to
obtain adequate sputum from every suspected PTB sufferer. To enhance sputum collection, various methods are available, from sputum induction and physiotherapy, to
more invasive procedures like bronchoalveolar lavage.11,22
It has been established from the literature that patient education, allied health worker training and involvement of the community are also of value in a
TB programme.18 Sputum collection should be done preferably in the early morning, in a secluded and well ventilated environment so that it does not
pose a threat of infection to others. Supervised sputum collection combined with patient instruction, is of great value in obtaining a good quality sputum specimen
(not mere saliva), as demonstrated by Sakundarno et al. in a study to determine factors associated with insufficient quality of sputum collected for PTB diagnosis
in Indonesia.23 They deduced that, in their district, only a few PTB suspects (45%) provided samples of good colour, viscosity and volume
(3.0 mL). One of the reasons identified for this result was poor patient education by health care workers on how to collect sputum. In our study patients
were guided on the correct way to provide sputum.
Sputum samples that were collected for this study were kept less than 1 hour after collection (en route to the laboratory), to avoid contamination with other
micro-organisms from possible excessive specimen handling in the ward. Studies have shown that sputum specimens for AFB detection could be preserved safely in the
refrigerator (4 ºC) for up to 8 weeks without affecting the sputum-smear positivity result.24,25 It has also been shown that there is always the
element of specimen container contamination in the wards which could lead to specimen contamination before the specimen reaches the laboratory.26,27
Nevertheless, in spite of the precautions, 8.5% of the specimens in our study tested positive for mycobacteria other than tuberculosis (MOTT) by culture.
Direct microscopy results tend to display variability depending on the microscopic field used, and the number of bacilli in a specific field as well as the
level of expertise of the microscopist. Comparing direct sputum microscopy and the NALC-NaOH (N-acetyl-L-cysteine-sodium hydroxide) method, Farnia et al.
established that the NSLC-NaOH method was more reliable. They found the sensitivity and specificity of NALC-NaOH method to be 83% and 97% respectively, which
was higher than that of direct sputum microscopy which stood respectively at 46% and 90%.28 The NALC-NaOH method was used in this study. This method,
however, is not performed in countries with limited resources. Errors by the microscopists in examining sputum smear slides could also have affected our study
results, thereby increasing the number of false negative smears. A study has shown that implementation of proficiency testing of microscopists and the introduction
of a rechecking system for external quality assurance could help in evaluating diagnosis.29 The process is labour intensive, however, especially in
countries with a high TB burden. The limitation of this study was the relatively small sample size.
This study has indicated a tendency towards superiority in the AFB microscopy results yield of the 5.0 mL specimen category compared to the 2.0 mL
category as indicated by the relatively higher sensitivity, specificity and predictive values. With regard to the likelihood ratio (LR), given a positive microscopy
with a 5.0 mL specimen, the ratio of a truly positive to a truly negative ratio is 192:1, that is, it is 192 times more likely to be truly positive than truly
negative. With a 2.0 mL specimen, the LR is 94:1. Therefore with a 5.0 mL specimen there is a greater chance (more than twice better) of finding a truly
positive result. From this point of view, the 5.0 mL specimen is to be recommended.
This study was conducted in partial fulfilment of the requirements for the award of the Master of Medicine (Family Medicine) degree at the University of
Limpopo, Medunsa campus. The researchers would like to thank Professor HS Schoeman and Ms AM Managa for guidance with statistical analyses.
Competing interests
The authors declare that they have no competing interests.
Authors’ contribution
I.R, M.L.H. and G.I. contributed to conception, design and data collection. All authors were involved in drafting the manuscript. P.D. read and
approved the final manuscript.
1. Enarson DA, Murray JF. Global epidemiology of tuberculosis. WN Rom and SM Garay, editors. Tuberculosis. Little, Brown, Boston, 1996; p. 57–75.
2. Dye C, Scheele S, Dolin P, Pathania V, Raviglione MC. Global burden of tuberculosis: estimated incidence, prevalence, and mortality by country: WHO
global surveillance and monitoring project. JAMA. 1999;282:677–686.
doi:10.1001/jama.282.7.677
3. World Health Organisation. Global Tuberculosis Control: WHO Report 2010. Geneva: WHO Press; 2010.
4. Department of Health: South Africa. Tuberculosis Strategic Plan for South Africa; 2007–2011. [homepage on the internet]. No date
[cited 2011 Mar 21]. Available from: http://www.info.gov.za/view/DownloadFileAction?id=72544
5. Todar, K. Todar’s online book of bacteriology. [homepage on the internet]. No date [cited 2010 Jan 12]. Available from:
http://www.textbookofbacteriology.net/
6. Warren JR, Bhattacharya M, De Almeida KNF, Trakas K, Peterson LR. A minimum 5.0 mL of sputum improves the sensitivity of acid-fast smear for
mycobacterium tuberculosis. Am J Respir Crit Care Med. 2000;161:1559–1562.
PMid:10806154
7. Parry CM, Kamoto O, Harries AD, Wirima JJ, Nyirenda CM, Nyangulu DS, et al. The use of sputum induction for establishing a diagnosis in patients with
suspected pulmonary tuberculosis in Malawi. Tuber Lung Dis. 1995;76(1):72–76.
doi:10.1016/0962-8479(95)90583-9
8. Gupta KB and Garg S. Use of sputum induction for establishing diagnosis in suspected pulmonary tuberculosis. Indian J Tuberc. 2005;52:143–146.
9. Medical University of South Africa (Medunsa). Dr George Mukhari Hospital Records (Level One wards) 2009/10. Pretoria, South Africa.
10. Perez-Guzman C, Torres-Cruz A, Villarreal-Velarde H, Varga MH. Progressive Age-related changes in Pulmonary Tuberculosis Images and the Effect of
Diabetes. Am J Respir Crit Care Med. 2000;162:1738–1740.
PMid:11069805
11. Chang KC, Leung CC, Yew WW, Tam CM. Supervised and induced sputum among patients with smear-negative pulmonary tuberculosis. Eur Respir J.
2008;31:1085–1090. doi:10.1183/09031936.00122907,
PMid:18448503
12. Foulds J, O’Brien R. New tools for the diagnosis of tuberculosis: the perspective of developing countries. Int J Tuberc Lung Dis. 1998;2:778–783.
PMid:9783521
13. Matee M, Mtei L, Lounasvaara T, Wieland-Alter W, Waddell R, Lyimo J, et al. Sputum microscopy for the diagnosis of HIV-associated pulmonary tuberculosis in
Tanzania. BCM Public Health 2008;8:68–72. doi:10.1186/1471-2458-8-68,
PMid:18289392,
PMid:2265272
14. Saglam L, Akgun M, Aktas E. Usefulness of induced sputum and fiberoptic bronchoscopy specimens in the diagnosis of pulmonary tuberculosis. J Int Med Res.
2005;33(2):260–265.
PMid:15790139
15. Harries AD, Maher D, Nunn P. An approach to the problems of diagnosing and treating adult smear-negative pulmonary tuberculosis in high-HIV-prevalence
settings in sub-Saharan Africa. Bull World Health Organ. 1998;76(6):651–662.
PMid:10191561,
PMid:2312485
16. Wu HP, Shieh WB, Hsien FK, Hua CC. The Significance of Mycobacterium tuberculosis Antibody, Antigen 60 IgG in Patients with Abnormal Chest Radiography.
Chang Gung Med J. 2004;27:869–876.
PMid:15754776
17. Cattamanchi A, Davis JL, Worodria W, et al. Sensitivity and Specificity of Fluorescence Microscopy for Diagnosing Pulmonary Tuberculosis in a High
HIV Prevalence Setting. Int J Tuberc Lung Dis. 2009;13(9):1130–1136.
PMid:19723403,
PMid:2754584
18. Bell DJ, Dacombe R, Graham SM, et al. Simple measures are as effective as invasive techniques in the diagnosis of pulmonary tuberculosis in Malawi.
Int J Tuberc Lung Dis. 2009;13(1):99–104.
PMid:19105886,
PMid:2873674
19. Yüksekol I, Bal S, Ozkan M, et al. The value of fiberoptic bronchoscopy in the diagnosis of smear negative pulmonary tuberculosis. Tuberk Toraks.
2003;51(4):405–409.
PMid:15143389
20. Lipsky BA, Gates JA, Tenover FC, Plorde JJ. Factors affecting the clinical value of microscopy for acid-fast bacilli. Rev Infect Dis. 1984;6:214–222.
doi:10.1093/clinids/6.2.214
21. Xavier R G, Savegnago F L, Damian F, et al. Evaluating the diagnosis of tuberculosis in induced sputum collection and bronchoalveolar lavage specimens.
Porto Alegre, Brazil: American College of Chest Physicians; 2005.
22. Hadley M and Maher D. Community involvement in tuberculosis control: lessons from other health care programmes. Int J Tuberc Lung Dis. 2000;4(5):401–408.
PMid:10815732
23. Sakundarno M, Nurjazuli N, Jati SP, et al. Insufficient quality of sputum submitted for tuberculosis diagnosis and associated factors, in Klaten
district, Indonesia. BMC Pulm Med. 2009;9(1):16–26.
doi:10.1186/1471-2466-9-16,
PMid:19426477,
PMid:2689165
24. Banda HT, Harries AD, Boeree MJ, et al. Viability of stored specimens for smear microscopy and culture. Int J Tuberc Lung Dis. 2000;4(3):272–274.
PMid:10751076
25. Parmasivan CN, Narayana AS, Prabhakar R, Rajgopal MS, Somasundaram PR, Tripathy SP. Effect of storing sputum specimens at room temperature on smear and
culture results. Tubercle. 1983;64(2):119–124. doi:10.1016/0041-3879(83)90036-3
26. Maciel EL, Prado TN, Peres RL, Palaci M, Johnson JL, Dietze R. Guided sputum sample collection and culture contamination rates in the diagnosis of
pulmonary TB. J Bras Pneumol. 2009;35(5):460–463. doi:10.1590/S1806-37132009000500012
27. Allen BW, Darrell JH. Contamination of specimen container surfaces during sputum collection. J Clin Pathol. 1983;36:479–481.
doi:10.1136/jcp.36.4.479,
PMid:6403598,
PMid:498251
28. Farnia P, Mohammadi F, Zarifi Z, Tabatabee D J, Ganavi J, Ghazisaeedi K. Improving sensitivity of direct microscopy for detection of acid-fast bacilli
in sputum; use of chitin in mucous digestion. J Clin Microbiol. 2002;40(2):508–511.
doi:10.1128/JCM.40.2.508-511.2002,
PMid:11825964,
PMid:153416
29. Martinez-Guarneros A, Balandrano-Campos S, Solano-Ceh MA, Lipman H, Ridderhof JC, Flisser A. Implementation of proficiency testing in conjunction with a
rechecking system for external quality assurance in tuberculosis laboratories in Mexico. Int J Tuberc Lung Dis. 2003;7(6):516–521.
PMid:12797692
|
|


